Many types of vegetables share similarities in color, texture, and shape, and even have different names in different countries. From production to delivery, several steps such as picking and sorting are still performed manually. This makes it challenging for customers to distinguish between similar vegetables at the market. The reliance on manual labor through many stages of vegetable production and consumption significantly hampers the commercialization of vegetable products.
To address this issue, implementing automation in the processes of picking, sorting, and labeling through a vegetable image classifier is essential, as it would save both time and money. In contemporary agriculture, fundamental research focuses on classification and detection because there are various kinds of vegetables that many people are unfamiliar with. This is why I decided to choose vegetable as the focus of the clustering and classification for this assignment.
I searched Kaggle for an appropriate dataset to work with. I want to work with as big a data set and I am allowed to (in this case being 200 images), so Kaggle seemed the efficient choice in finding all the labelled images I needed in classified folders. I was lucky to find the paper “DCNN-Based Vegetable Image Classification Using Transfer Learning: A Comparative Study” by Asif Uz Zaman Asif, Mohammed Israk Ahmed, and Shahriyar Mahmud Mamun. The dataset they used for their research was exactly what I needed, and their large dataset provided all the testing images I required. In fact, I had to remove most of the dataset to stay within the 200 images limit.
Part 1
For the section of the assignment, I collected 20 images of 10 different vegetables, all in one folder to makeup a dataset of 200 images. The vegetables were tomato, radish, pumpkin, potato, cucumber, cauliflower, carrot, capsicum, cabbage, and broccoli.
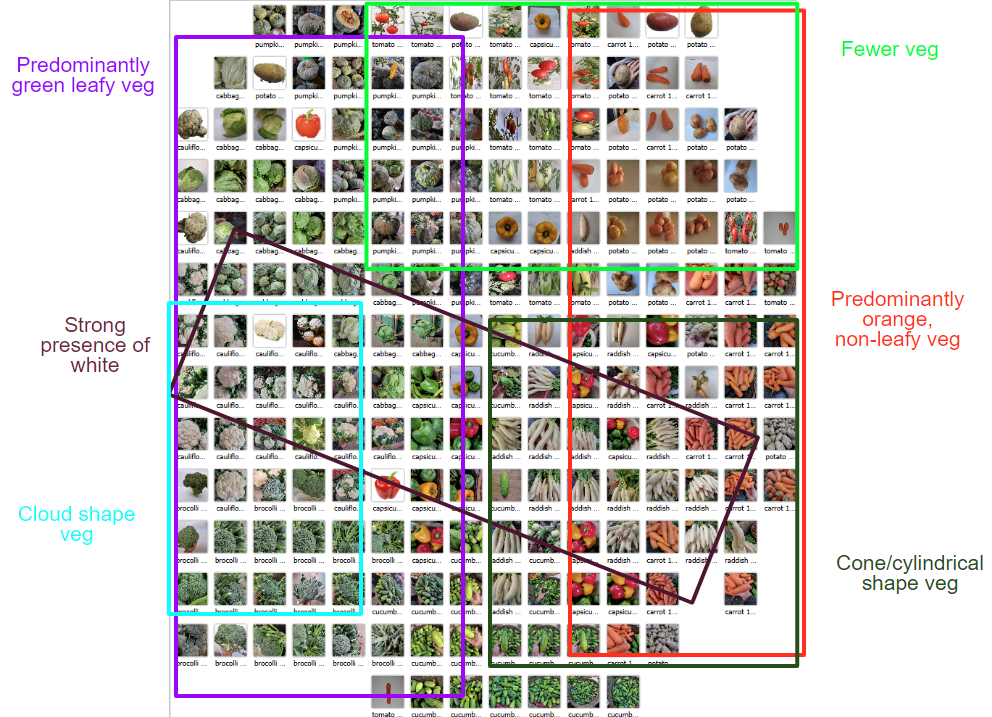
- Fig 1.1 Marked Inception v3 labelled image grid*
Fig 1.1 is image grid created by the inception v3 algorithm that I’ve marked over. I think it did a relatively decent job at organizing the vegetables. On the left are most of the green leafy and the right is populated by all the other colors, but mainly orange vegetables. With this being the cause veg like cabbage, broccoli end up on the left and carrots and potatoes end up on the right. Also visible is a diagonal strip of white veg, consisting of cauliflower and radishes, running across the columns. We can also make out the algorithm has also considered the shape and texture of vegetables. The cylindrical/cone shaped veg (like carrots and radishes) are concentrated in the bottom right of the grid.
The more knobbly, cloud shaped veg (like broccoli and cauliflower) are concentrated along the left end of the grid. We can also see a variance in plurality in the grid. The images in the bottom right have many more vegetables in each image compared other images on the grid. This is most probably due to similar shots taken of the carrots, radishes, and cucumbers. To sum up, most vegetables look like they’ve been well within their groups, except for capsicums which are more sparsely spread out near the middle of the grid.
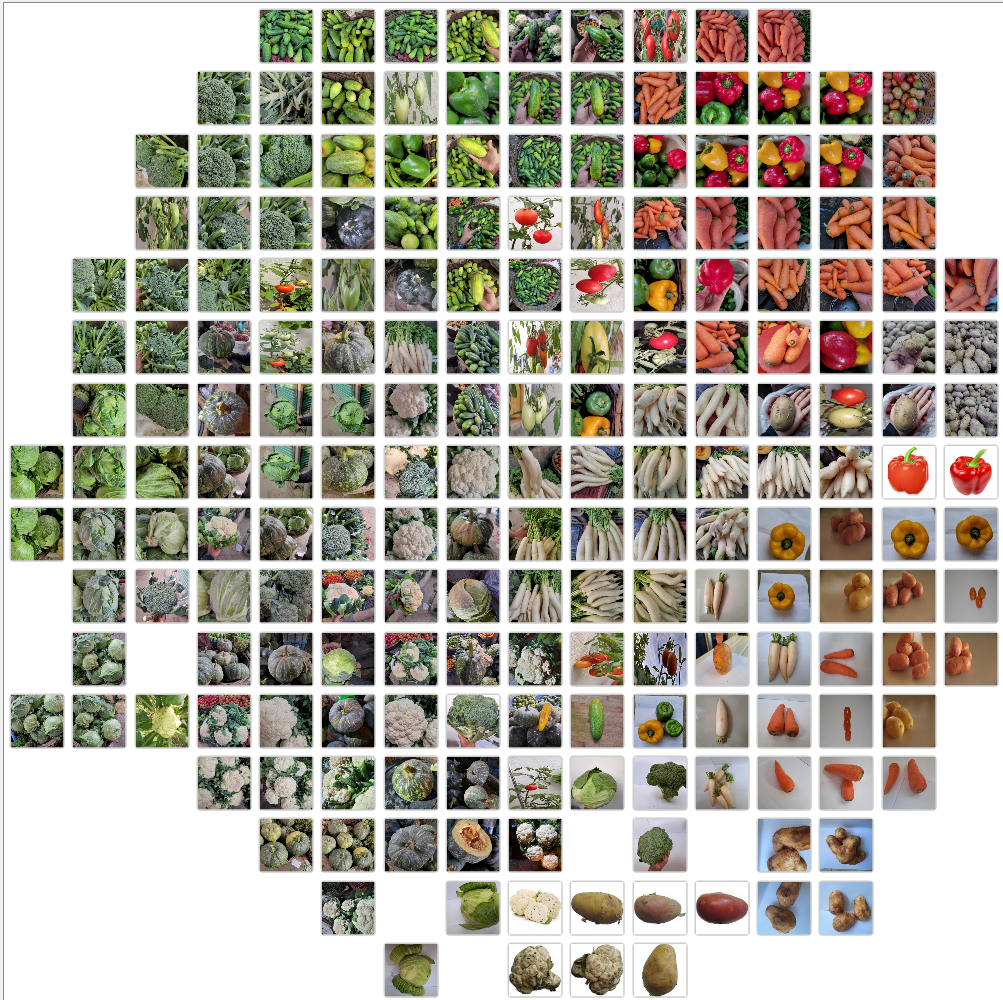 Fig 1.2 Painters image grid
Fig 1.2 is the resulting image grid when using the Painters algorithm. I think this algorithm does a better job at grouping colors together but not the contents of the images (in this case being vegetables). What I mean by this is, this grid has a clear group of orange and red vegetable in the top right corner of the grid, but it doesn’t do a good job of distinguishing between capsicums and carrots in that corner.
Also, like with the inception v3 generated grid, there seems to a spread of white vegetable (radishes and cauliflower) across columns. Like Inception v3, the Painter algorithm looks to be having a hard time grouping the capsicum together, perhaps due to their different colors. One major difference is that in Fig 1.2, there is no clear association or relation between broccoli and cauliflower, whereas in Fig 1.1, we saw the two vegetables groups next to each other.
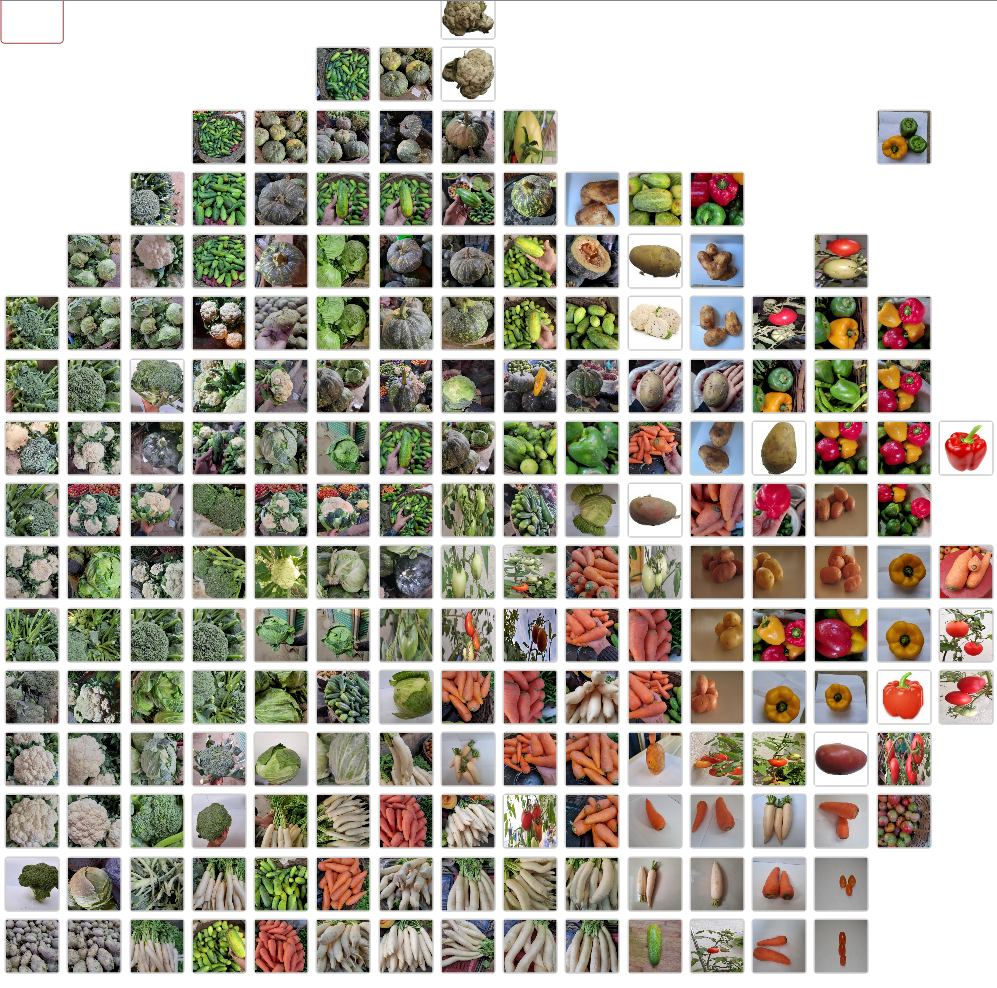 Fig 1.3 SqueezeNet image grid
We see, a similar job done by the SqueezeNet algorithm. I was surprised to see most of the capsicums grouped together in the top right, which was better than the previous two algorithms had grouped them. However, SqueezeNet has performed considerably worse with the other vegetable groupings. One of which is cucumbers, which is spread throughout the grid, from the very top to the very bottom.
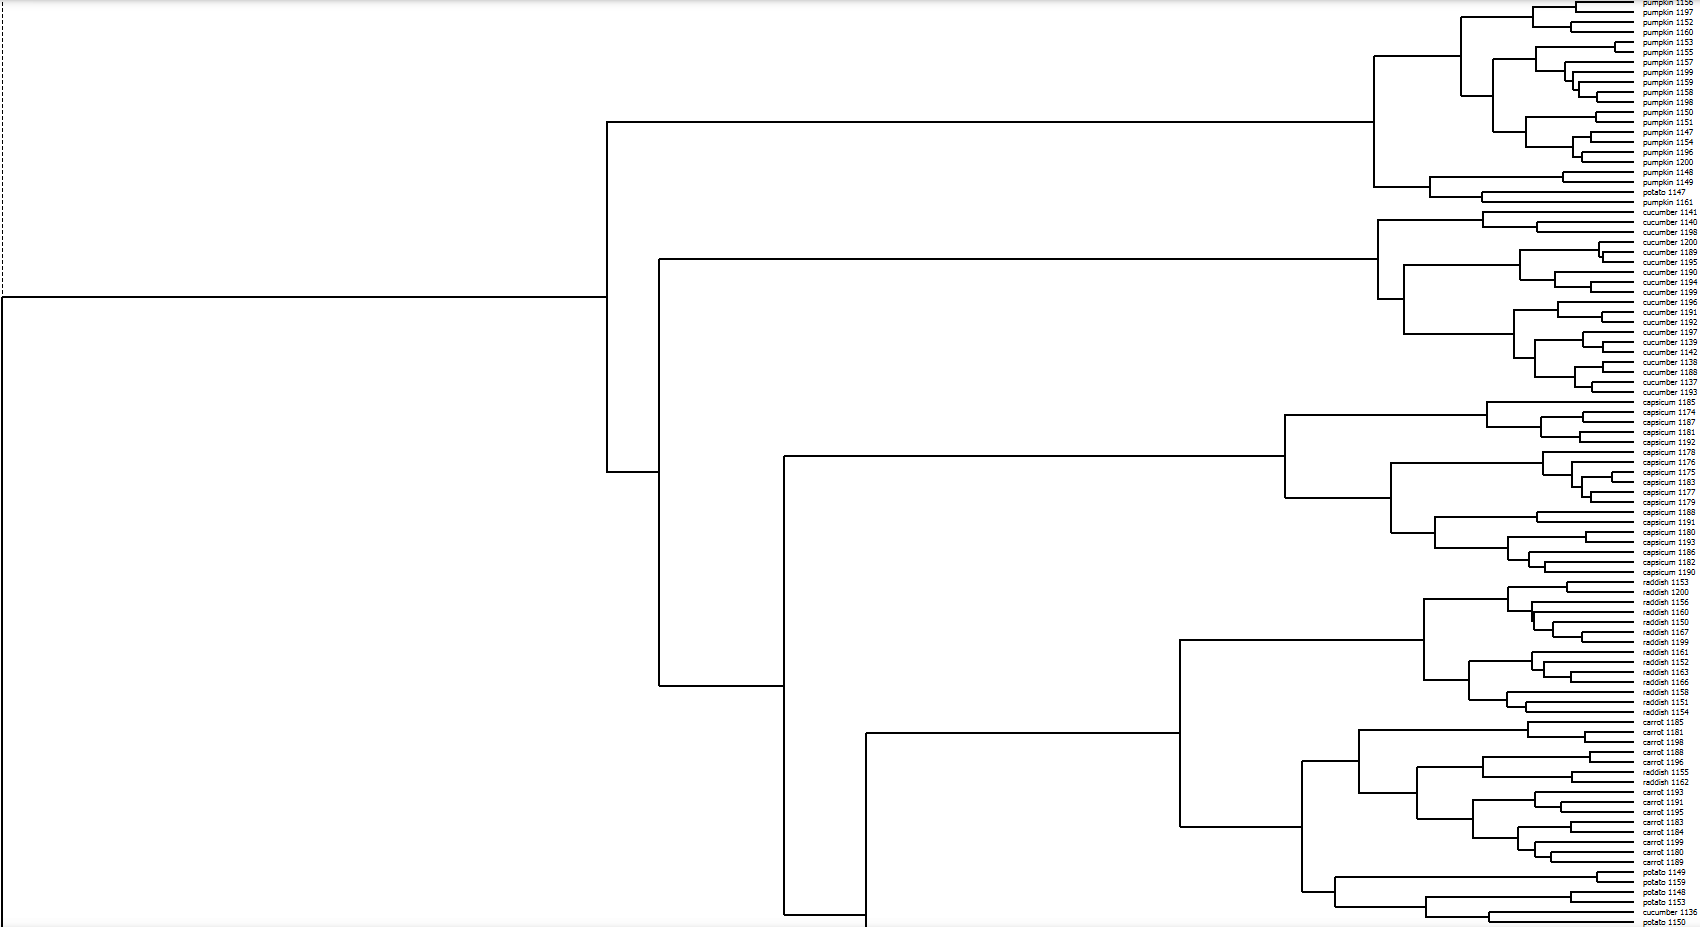 Fig 1.4 top half hierarchical clustering by Inception v3
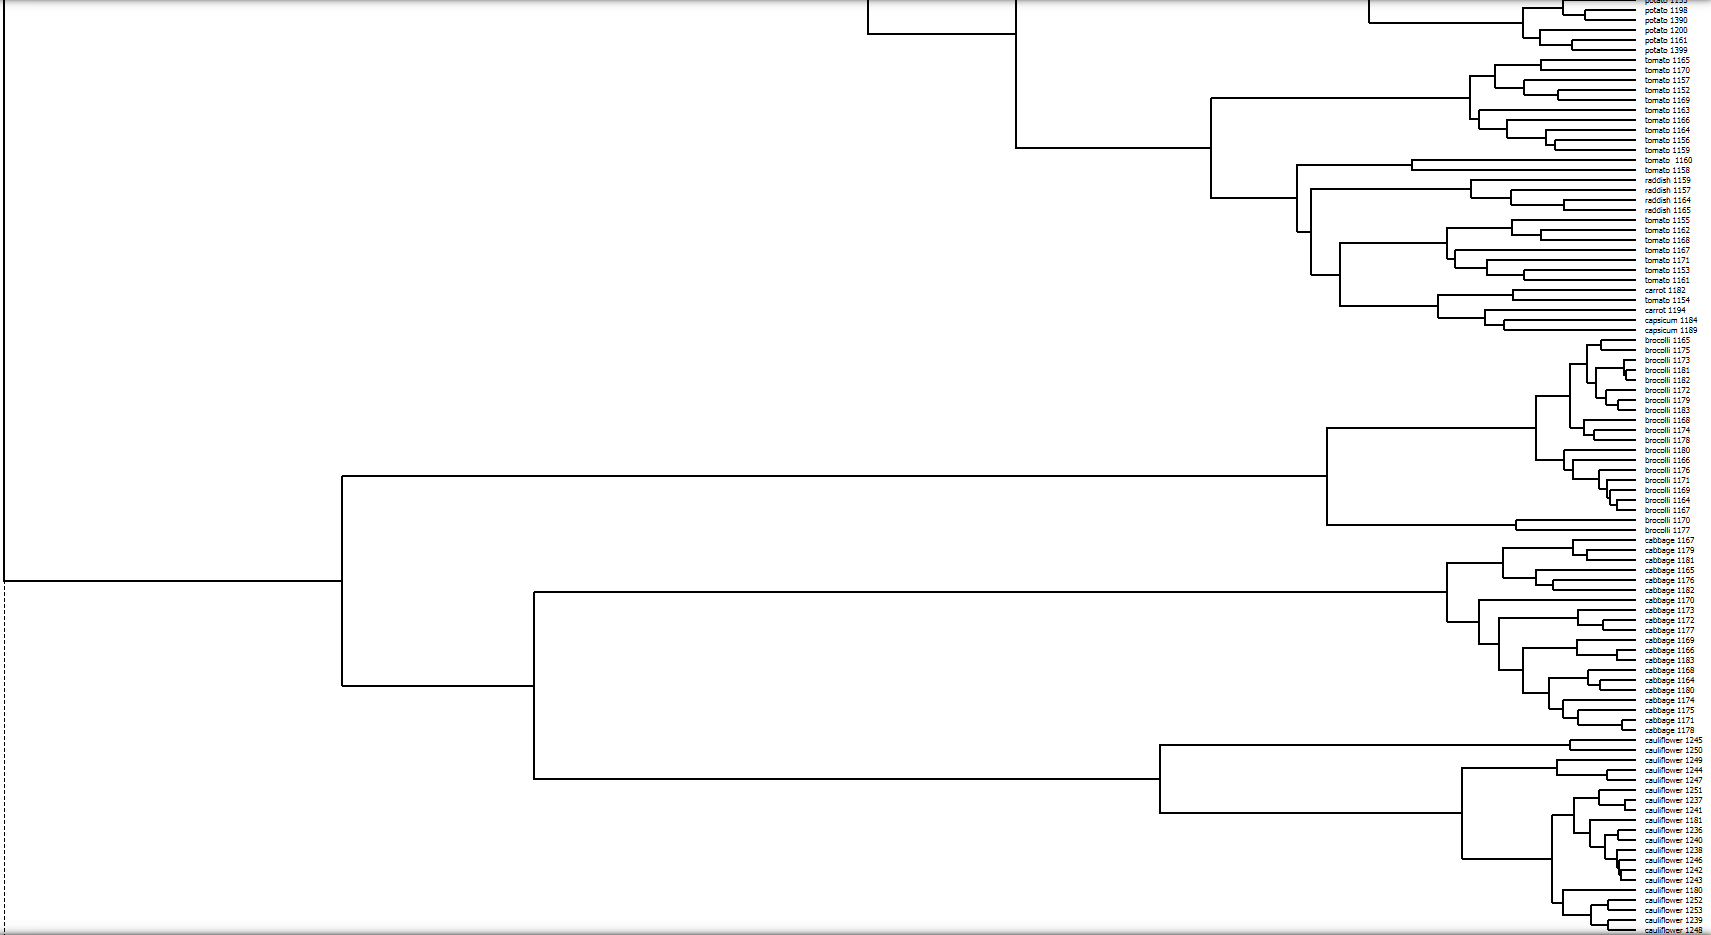 Fig 1.5 bottom half hierarchical clustering by Inception v3
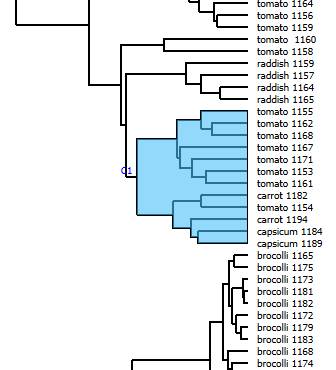
Fig 1.6 section of bottom half hierarchical clustering by Inception v3
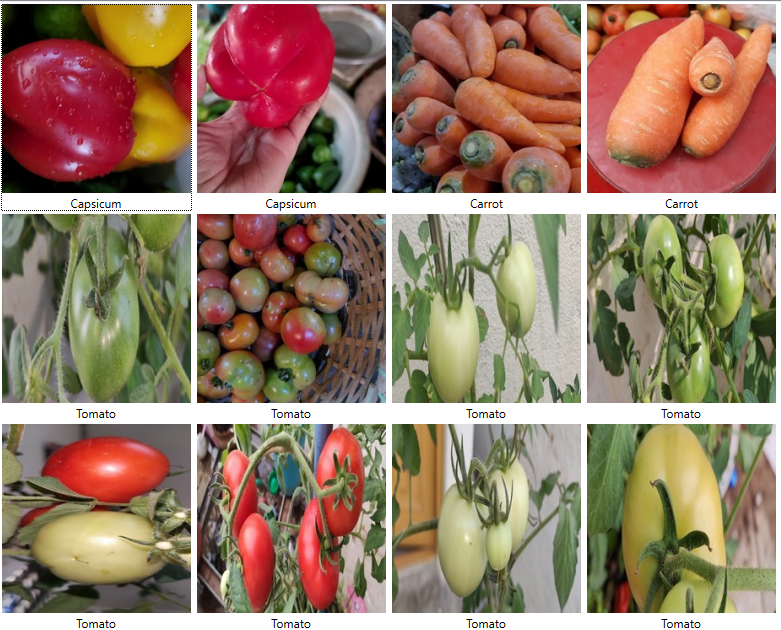 Fig 1.7 images of section of bottom half hierarchical clustering by Inception v3
I am very curious as to how the algorithm “sees” these vegetables clustered together in Fig 1.6 to put them together. Perhaps it is there roughly spherical shapes, but the carrots violate this relation. Perhaps it is the red/orange hues of the vegetables that bring them together, but the green tomatoes seem to be outliers in this case. Majority of the images are of tomatoes, which the algorithm seems to groups together based on their shapes. I can understand how the algorithm might have mistaken the smooth curved exterior of the capsicums to be that of tomatoes. The carrots however look completely different. Perhaps the algorithm is seeing something in the circular stumps of the carrots, but I cannot say I am confident about that.
It took me long to organise and name all the images for the dataset, and I was only working with 200 samples. How much more manual work would be needed when working with datasets in the millions or billions? The chapter from “Distant Viewing: Computational Exploration of Digital Images” discusses the application of computer vision algorithms to digital images, which is referred to as “distant viewing.” This technique involves using computational methods to analyze large collections of images by creating structured annotations that capture essential information within these images. These annotations are used to explore and interpret visual messages across a collection, enabling a new kind of visual analysis that exceeds human capabilities in terms of scale and detail.
The chapter emphasizes that while computer vision can process images quickly and on a large scale, the annotations it produces are influenced by the cultural, social, and technical contexts in which the algorithms were developed. Therefore, distant viewing is not just a technical method but also involves critical engagement with the ways images make meaning and how they are processed computationally. Distant viewing is presented as an iterative, exploratory process, mirroring traditional methods used for smaller image collections but enhanced by the speed and scalability of computer vision. This approach allows for deep insights into visual cultures, powered by the ability to analyze vast numbers of images rapidly and detect patterns that may not be visible to the human eye.
Part 2
For this section of the assignment, I stored all the 200 images of vegetables into their corresponding folders. I ended up with 10 folders of 20 images each.
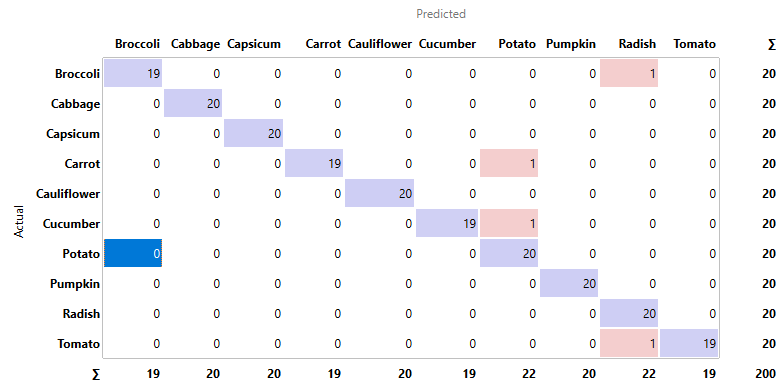 Fig 1.8 confusion matrix for inception v3
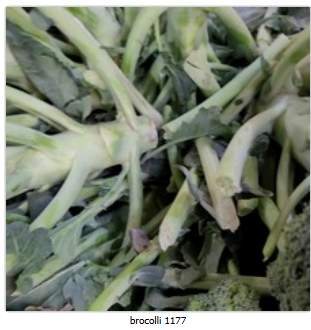
Fig 1.9 false positive for radish which is actually a broccoli
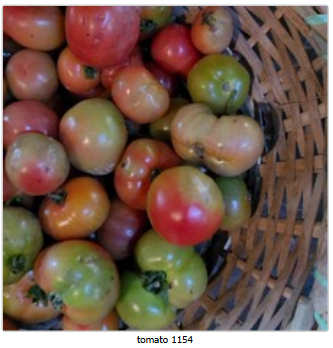
Fig 2.1 false positive for radish which is actually tomatoes
Fig 2.2 false positive for potato which is actually carrot
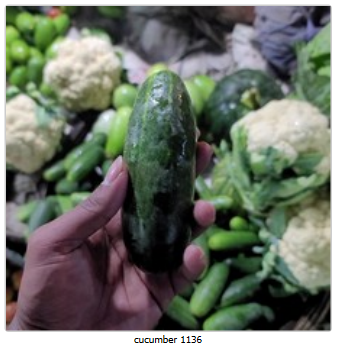
Fig 2.3 false positive for potato which is actually cucumber
All things considered, inception v3 did is good job with classifying the vegetables according to the confusion matrix in Fig 1.8. Fig 1.9 shows a false positive for radish which is actually a broccoli. Perhaps this is because this is a very close image of the light green stem of the broccoli which could be confused for the long cylindrical body of a radish. In Fig 2.1, the algorithm registered a false positive for a radish which is actually tomatoes. I am not sure how Inception could have possibly decided this was a radish. None of the images of radishes in the dataset resemble Fig 2.1, so I am completely stumped here.
As for Fig 2.2, where the algorithm concluded a false positive for potato which is actually carrots, perhaps it was because of the white background. Eight of the potato images in the dataset also have white backgrounds. In the case of Fig 2.3, where Inception v3 saw a false positive for potato which is actually a cucumber, it might have been because of the hand holding the cucumber. Three of the images from the potato folder have a hand holding a potato as well.
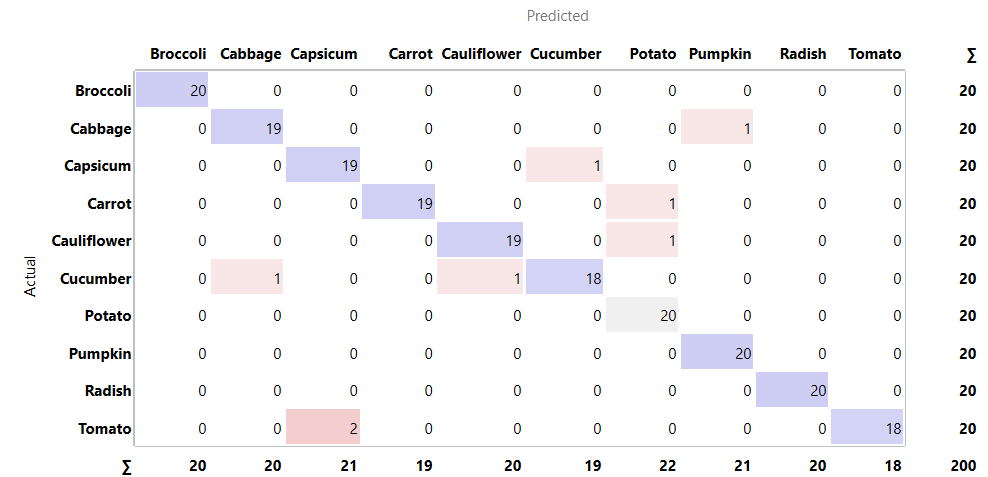 Fig 2.4 confusion matric for Painter
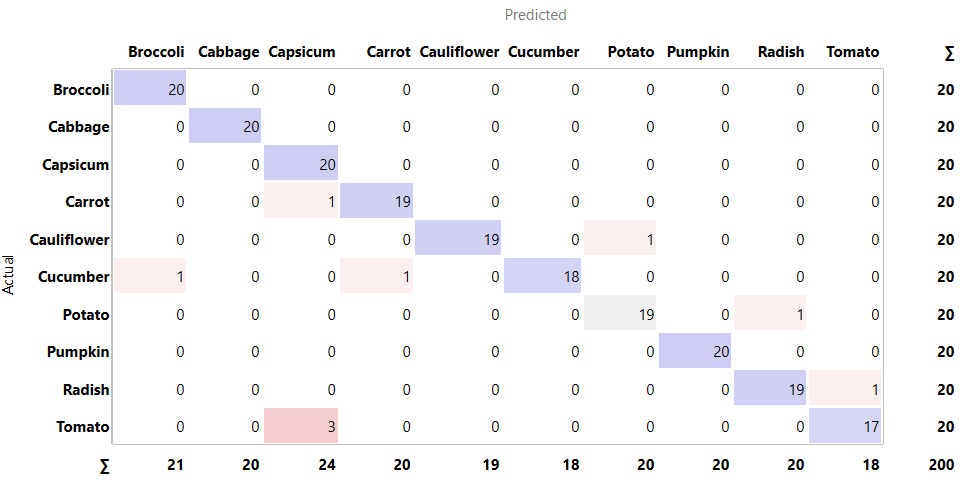 Fig 2.5 confusion matric for SqueezeNet
Fig 2.4 and Fig 2.5 also show the confusion matrices of other algorithms, like Painter and SqueezeNet respectfully. They have performed more poorly when compared to Inspection v3.
]]> Author Margaret Astrid Lindholm Ogden
 Assassin’s Apprentice cover — book 1 of the Farseer Trilogy
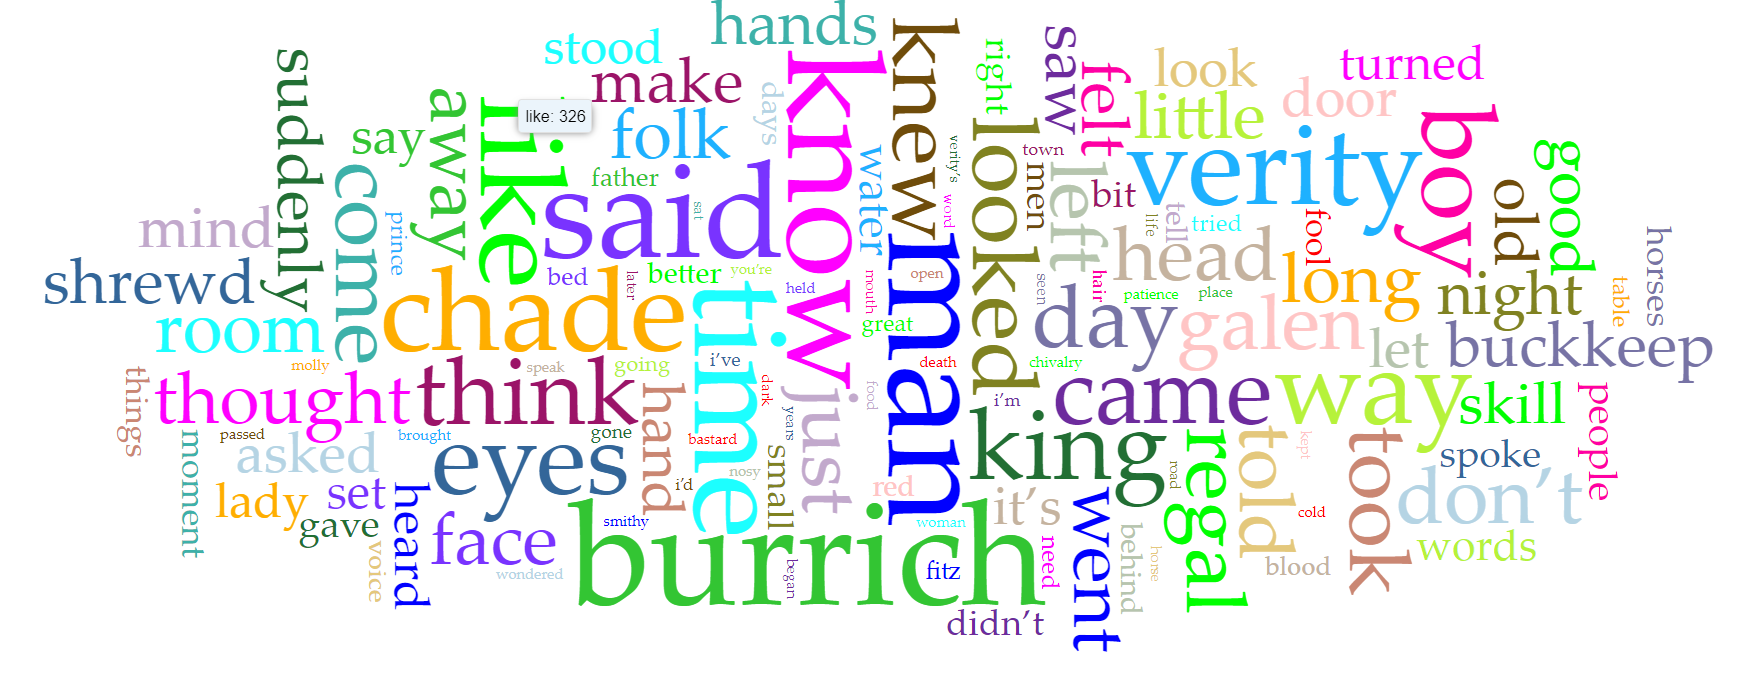 Word cloud of Assassin’s Apprentice
 Word cloud of Royal Assassin
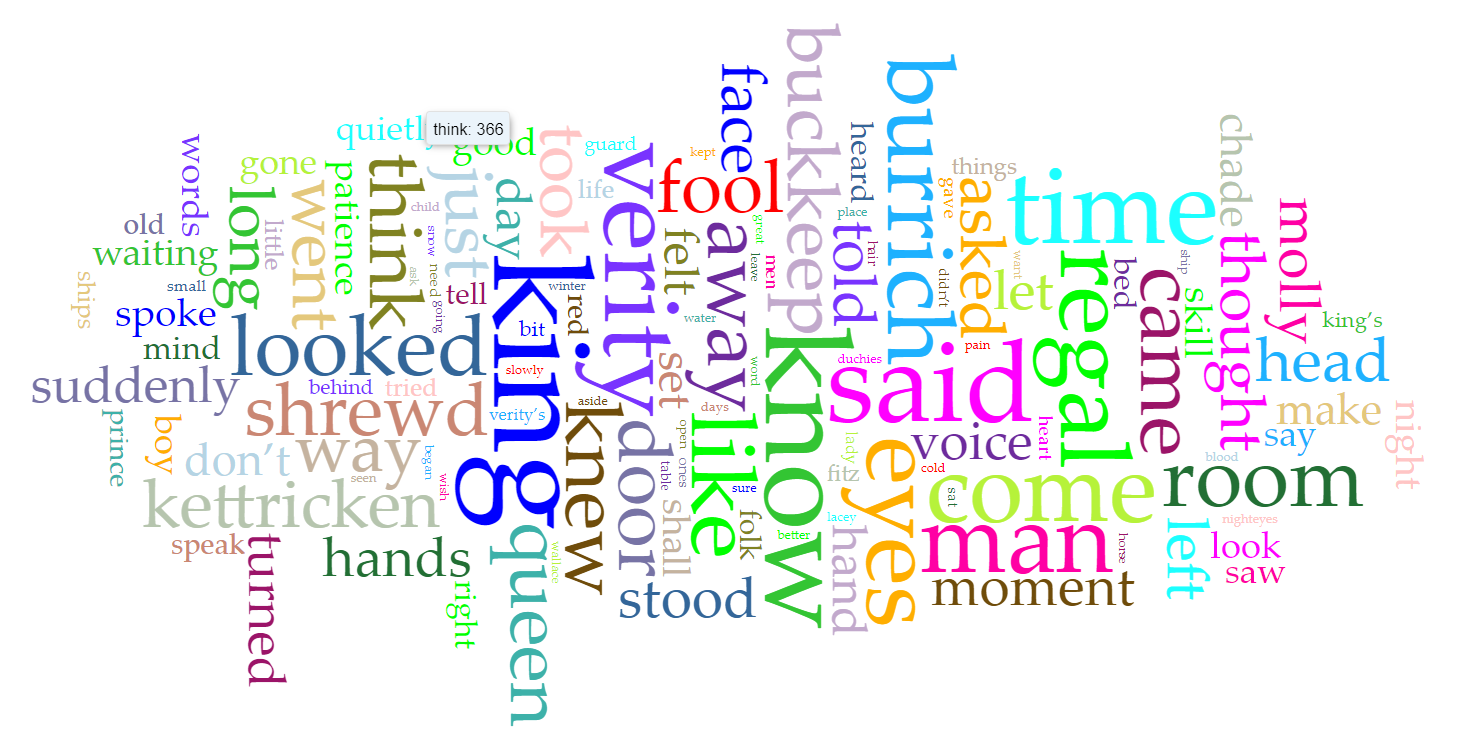
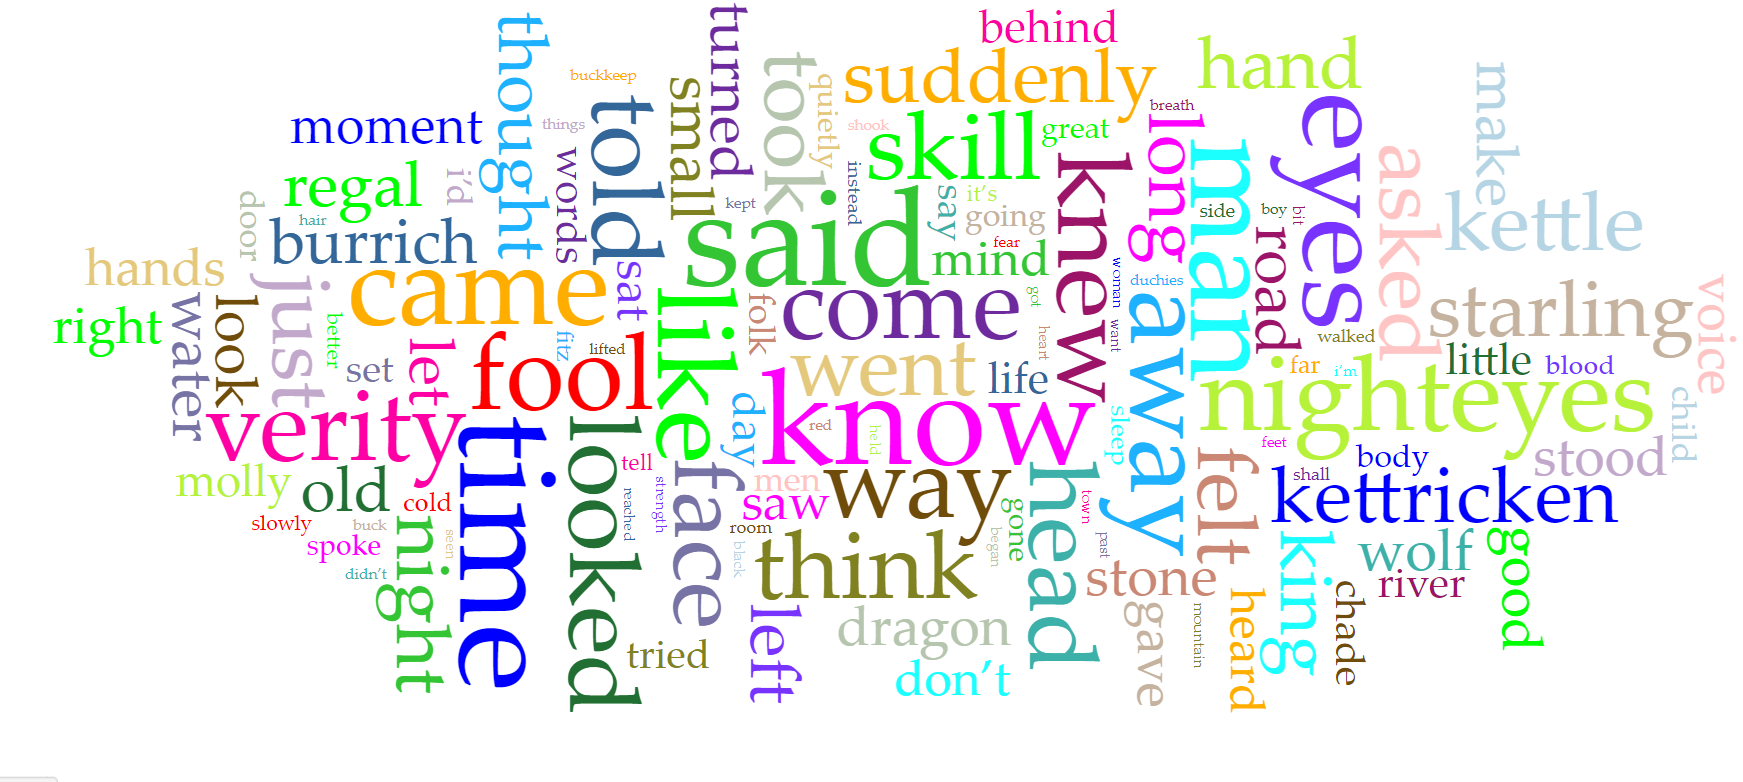 Word cloud of Assassin’s Quest
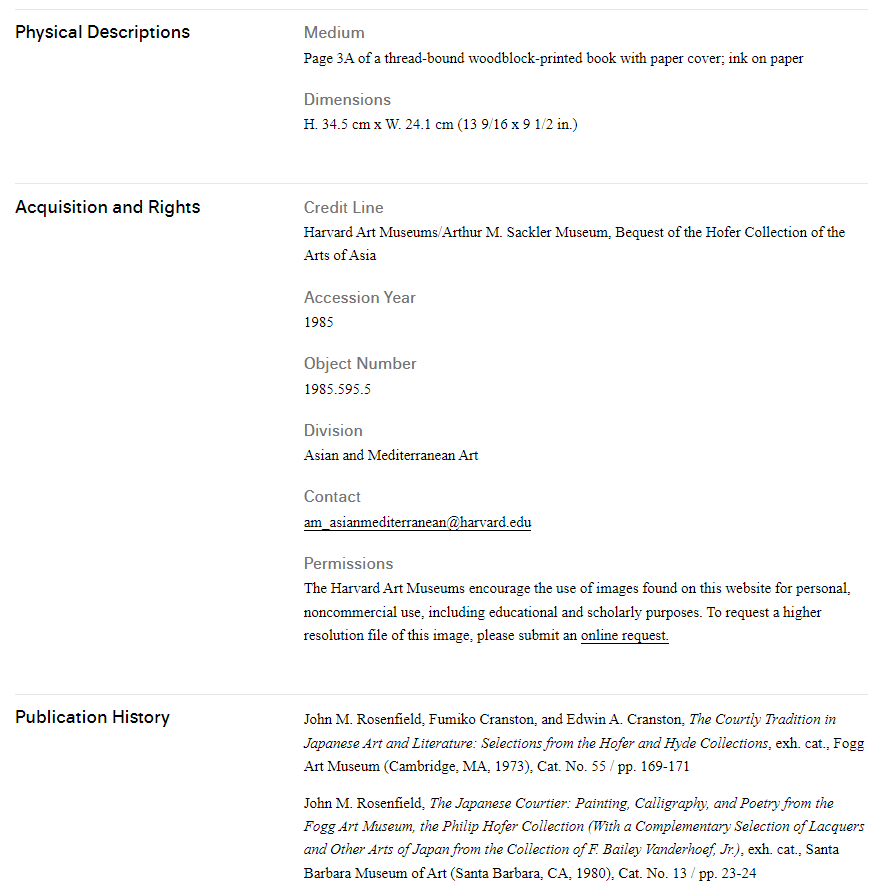 Poet Sosei Hōshi of the printed book of “Thirty-Six Immortal Poets” on HAM website
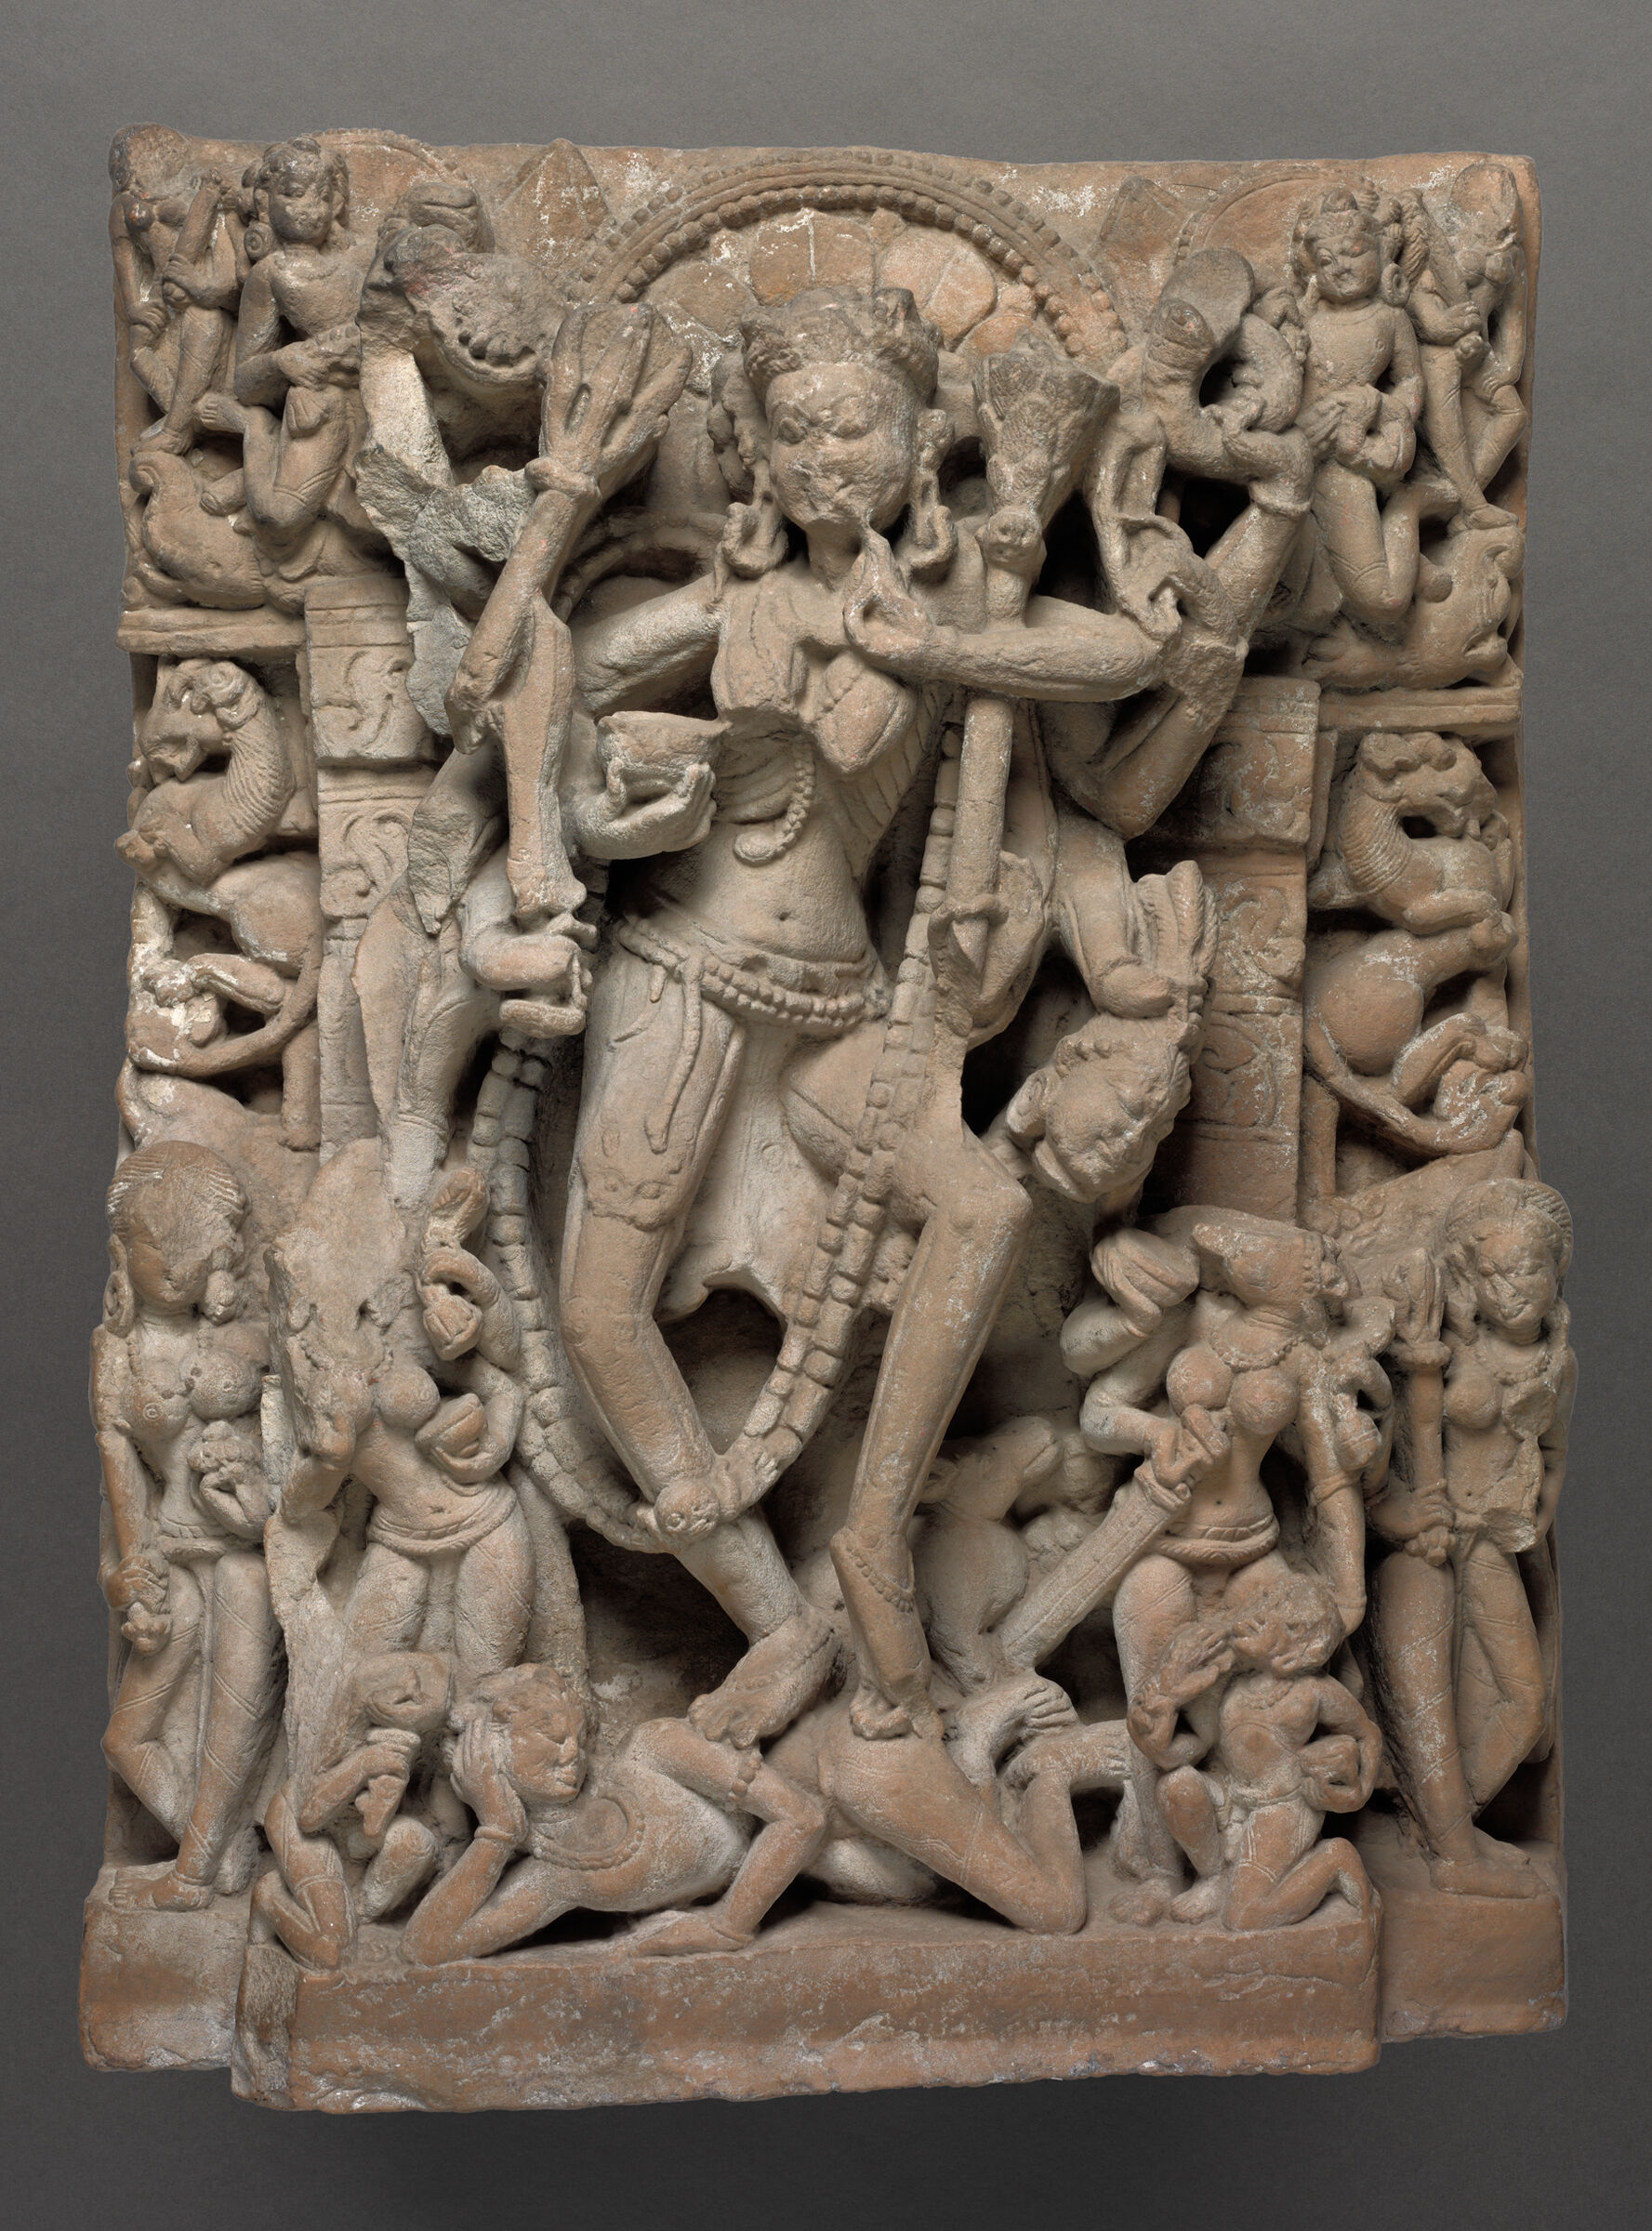 Architectural Relief with Chamunda
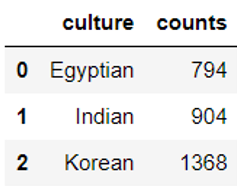
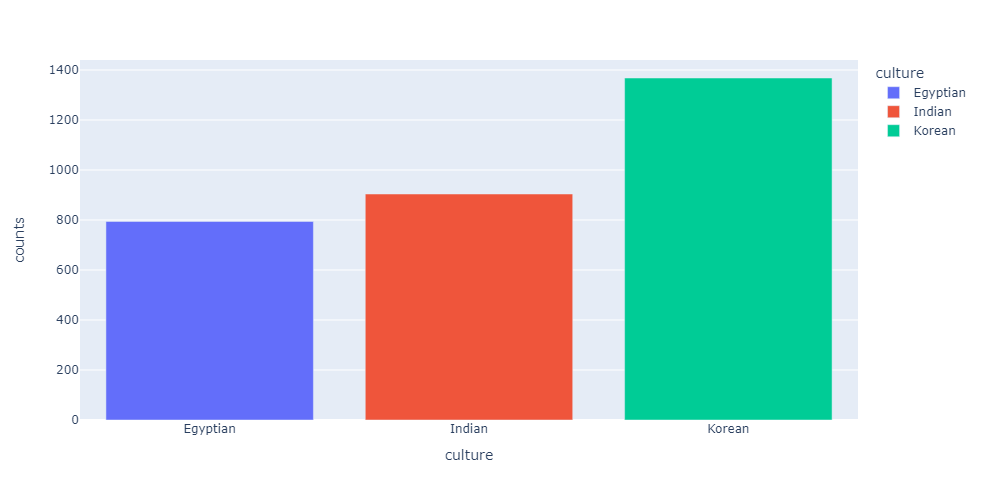 chart of cultures
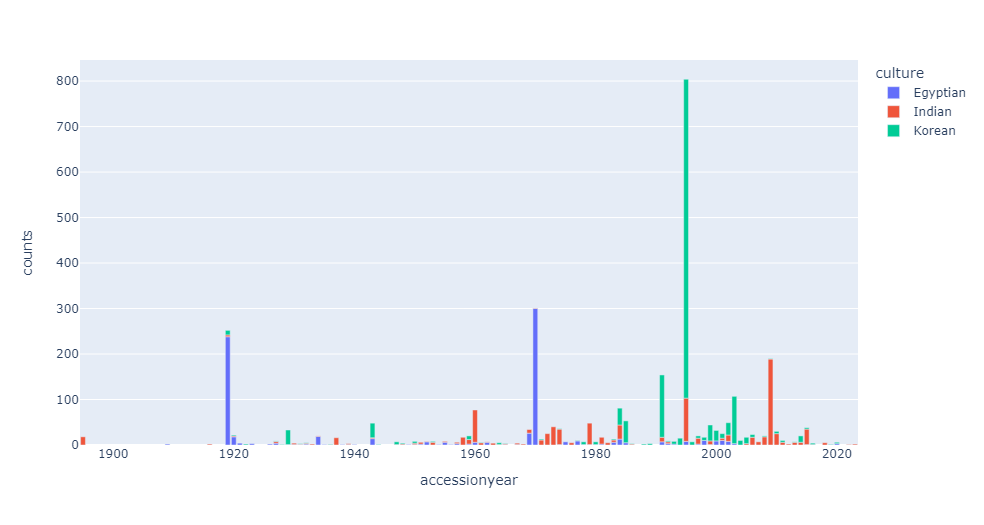 chart of accession year data of pieces from cultures
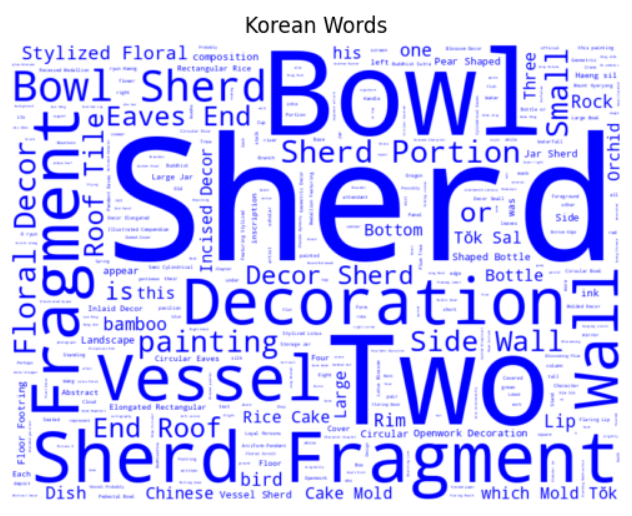 word cloud for Korean pieces
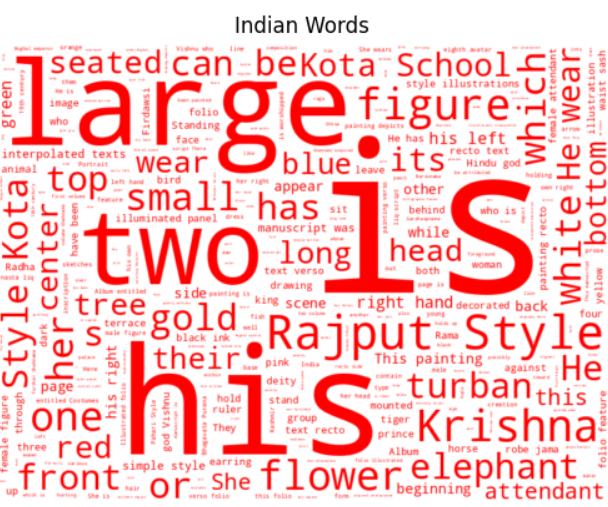 word cloud for Indian pieces
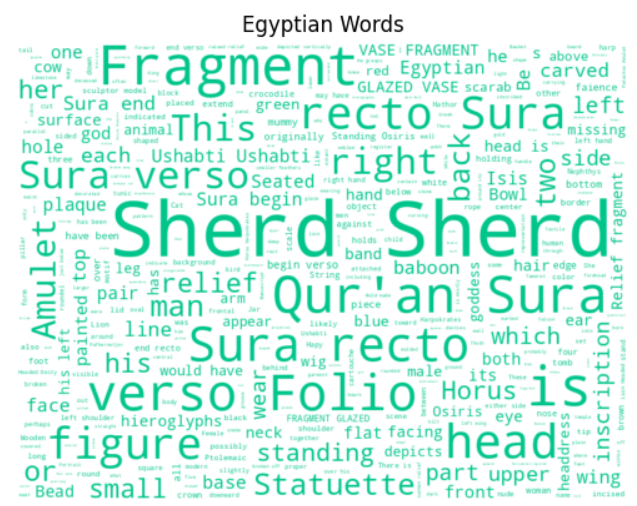 word cloud for Egyptian pieces